

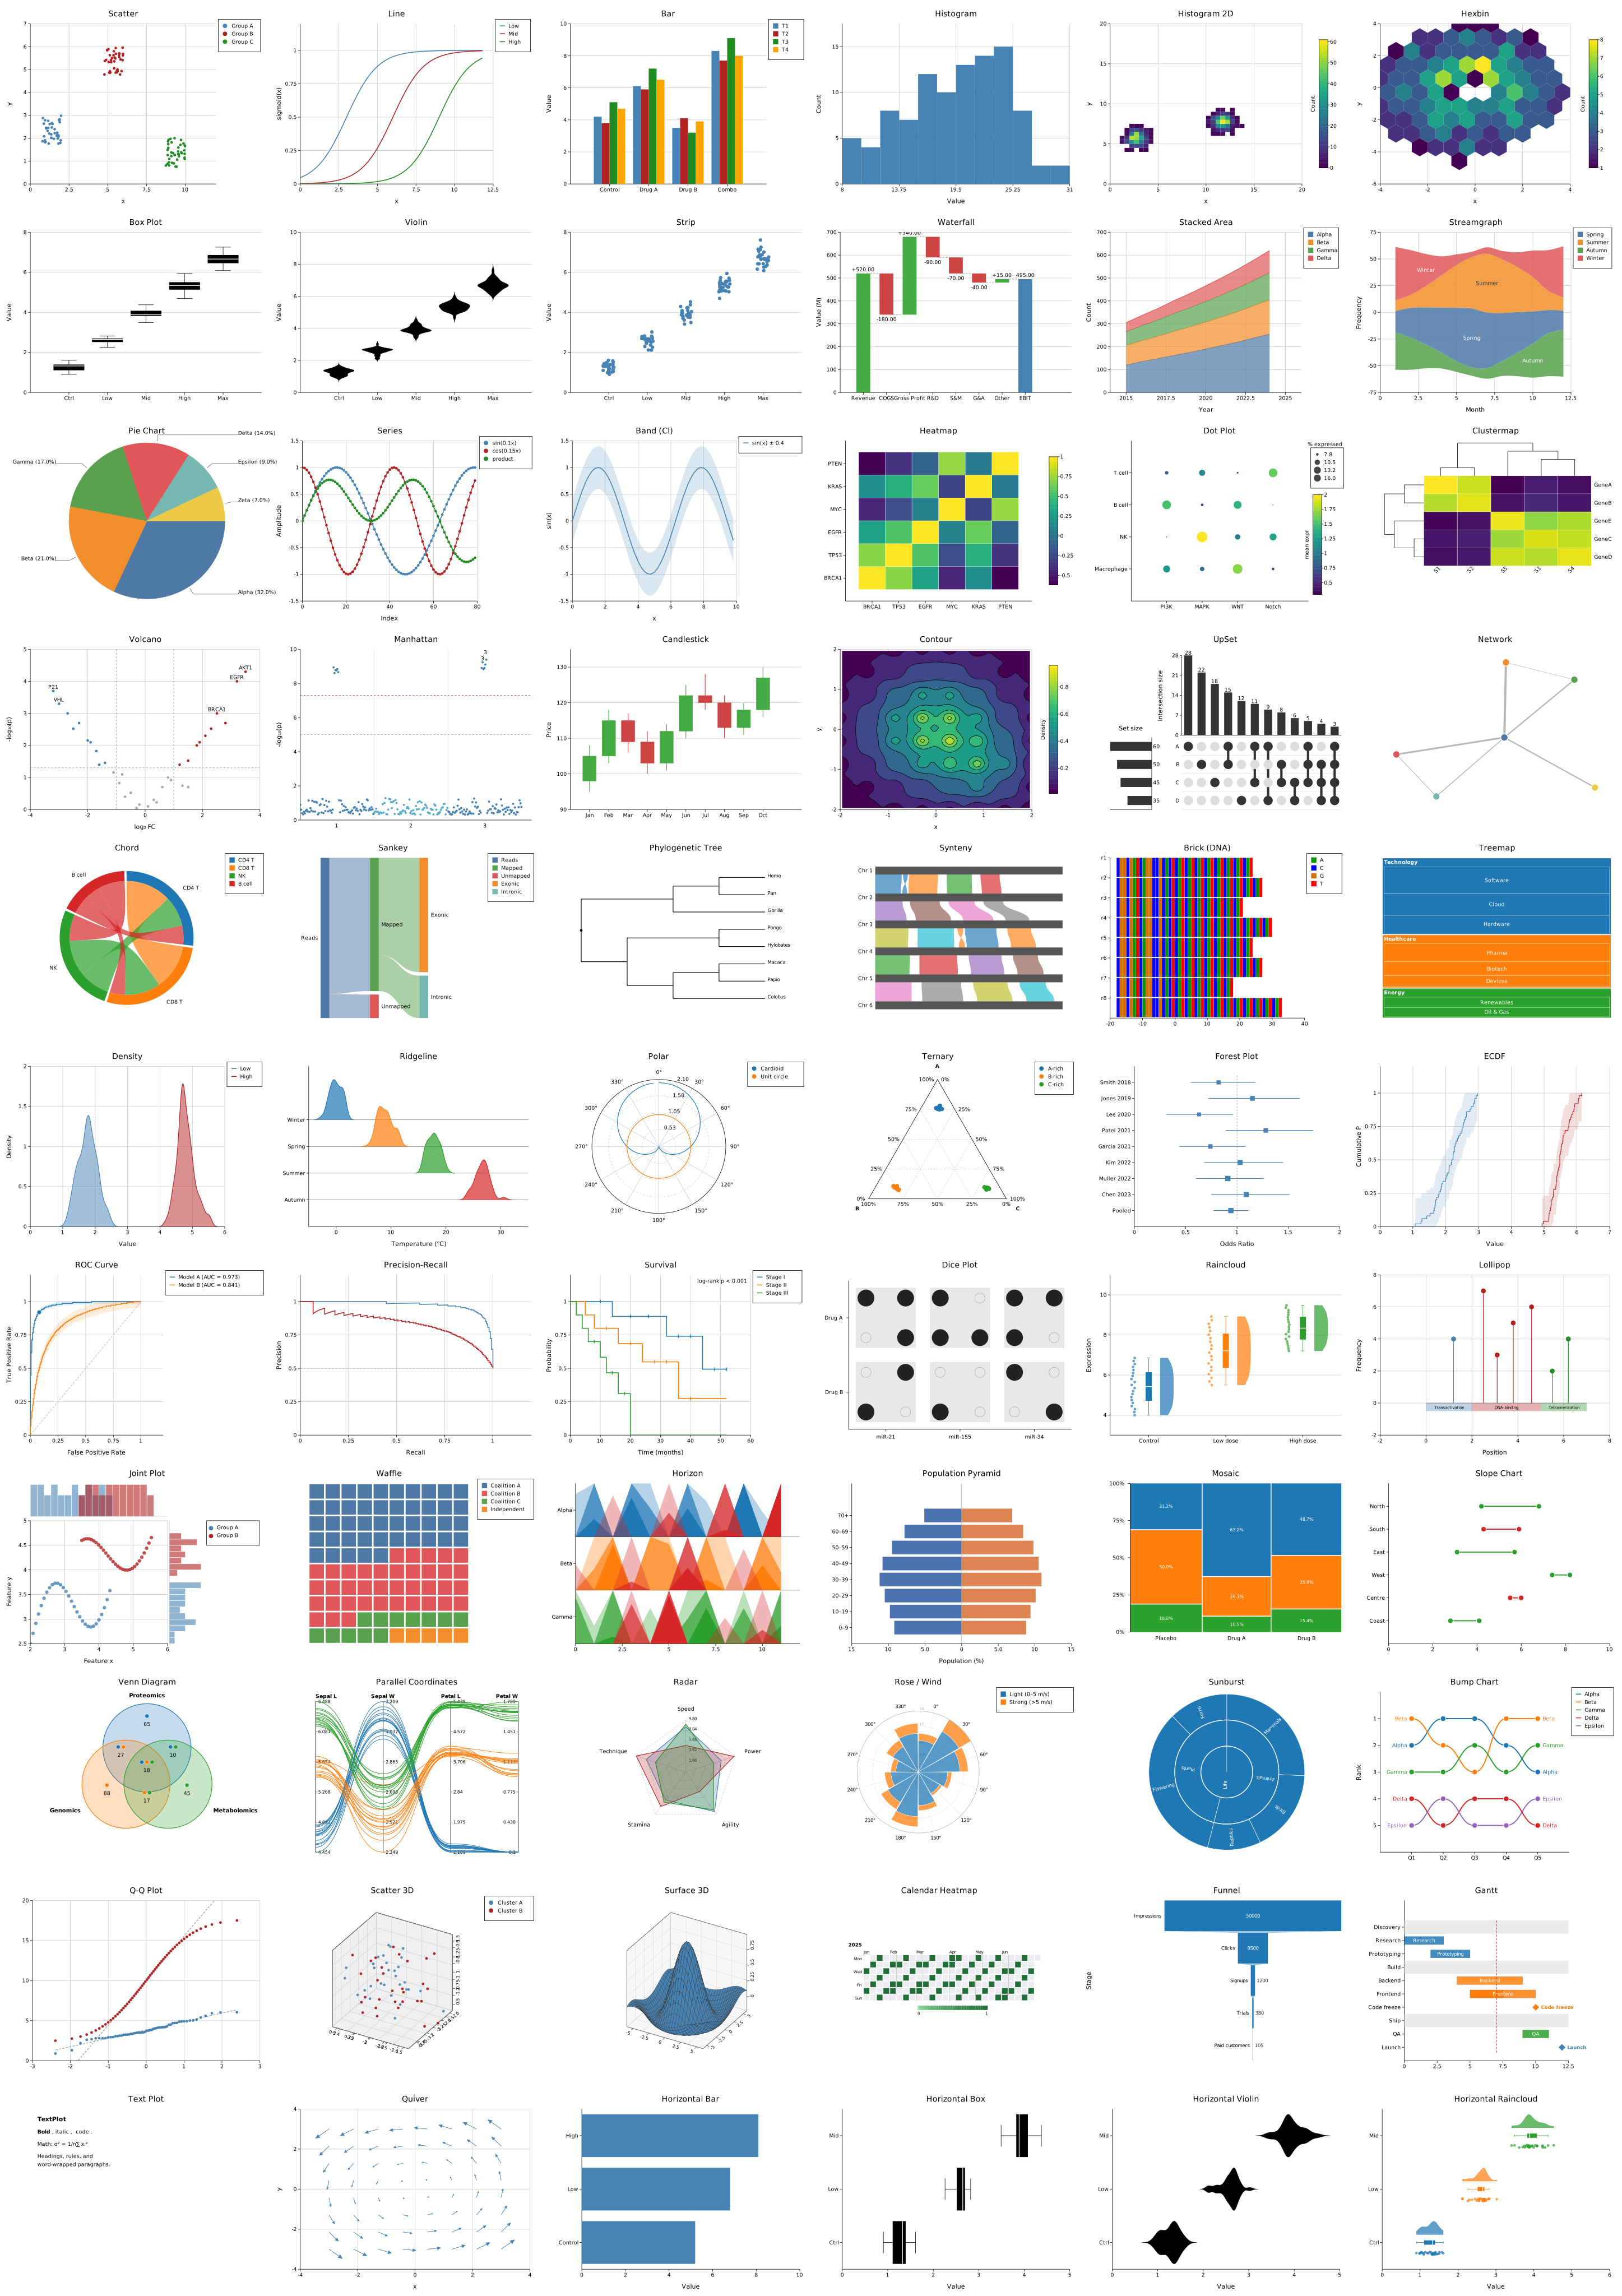
A scientific plotting library in Rust. 64 plot types, SVG output, optional PNG/PDF backends, and a CLI binary that renders plots directly from the shell — including in the terminal itself.

Step 1 — install Rust (skip if you already have cargo):
curl --proto '=https' --tlsv1.2 -sSf https://sh.rustup.rs | sh
# then restart your shell, or run:
source ~/.cargo/env
Step 2 — install kuva:
# From crates.io — installs to ~/.cargo/bin/ (on your $PATH after rustup setup)
cargo install kuva --features cli

# From a local clone — SVG output only
cargo install --path . --features cli

# From a local clone — with PNG and PDF output
cargo install --path . --features cli,full
After installation, kuva is available anywhere in your shell — no need to reference ./target/release/kuva or set any paths manually.
Add to Cargo.toml:
[dependencies]
kuva = "0.6"

# Optional backends
kuva = { version = "0.6", features = ["png"] }   # PNG output
kuva = { version = "0.6", features = ["pdf"] }   # PDF output — requires Rust >= 1.92 (higher than kuva's own MSRV; see below)
kuva = { version = "0.6", features = ["full"] }  # PNG + PDF

# Opt-in extras (deliberately not in `full`)
kuva = { version = "0.6", features = ["typst-math"] }  # typeset $...$ math via the Typst compiler — requires Rust >= 1.89
kuva = { version = "0.6", features = ["typst"] }       # emit .typ markup for external `typst compile`
Note on the
krilla(the maintained successor to the now-archivedsvg2pdf), which requires Rust >= 1.92. This isn't reflected in kuva's crate-levelrust-version— doing so would force every kuva user, including ones who never enablefull, kuva itself still only needs Rust 1.87.
Then in Rust:
use kuva::prelude::*;

let plot = ScatterPlot::new()
    .with_data(vec![(1.0_f64, 2.0), (3.0, 5.0), (5.0, 4.0)])
    .with_color("steelblue")
    .with_legend("samples");

let plots: Vec<Plot> = vec![plot.into()];
let layout = Layout::auto_from_plots(&plots)
    .with_title("My Plot")
    .with_x_label("X")
    .with_y_label("Y");

let svg = render_to_svg(plots, layout);
std::fs::write("my_plot.svg", svg).unwrap();
# Scatter plot to SVG
kuva scatter data.tsv --x x --y y -o plot.svg

# Volcano plot, label top 20 genes
kuva volcano gene_stats.tsv --name-col gene --x-col log2fc --y-col pvalue --top-n 20

# Ridgeline plot — stacked density curves, one per group
kuva ridgeline samples.tsv --group-by group --value expression --overlap 0.6

# Box plot rendered directly in the terminal
kuva box samples.tsv --group-col group --value-col expression --terminal
Input is auto-detected TSV or CSV. .parquet files are also supported. Columns are selectable by name or 0-based index. Pipe from stdin by omitting the file argument. Output defaults to SVG on stdout; use a .svg, .png, or .pdf extension with -o to write a file. Extensions are case-insensitive, and other extensions are rejected.
Full documentation — plot type reference, API guide, CLI flag reference, themes, palettes, and benchmarks — is at psy-fer.github.io/kuva.
Thank you to everyone who has contributed to kuva!
Other Rust plotting libraries worth knowing about:
- charton: A general-purpose plotting library implementing the Grammar of Graphics in Rust. It offers a declarative API (similar to ggplot2/Altair) that builds complex charts through layer composition. It provides first-class native support for Polars, integrates with the Jupyter/evcxr ecosystem, and can even interoperate with Matplotlib/Altair for hybrid workflows.
kuva was initially built by hand, with a working library and several plot types already in place before AI tooling was introduced. From that point, development was heavily assisted by Claude (Anthropic) — accelerating the addition of new plot types, the CLI binary, tests, and documentation. The architecture, domain knowledge, and direction remain the author's own; Claude was used as an accelerant, not an author.
This disclaimer was written by Claude as an honest assessment of its own role in the project.
MIT